


1.2B wireless. 47M wireline connections. 25X
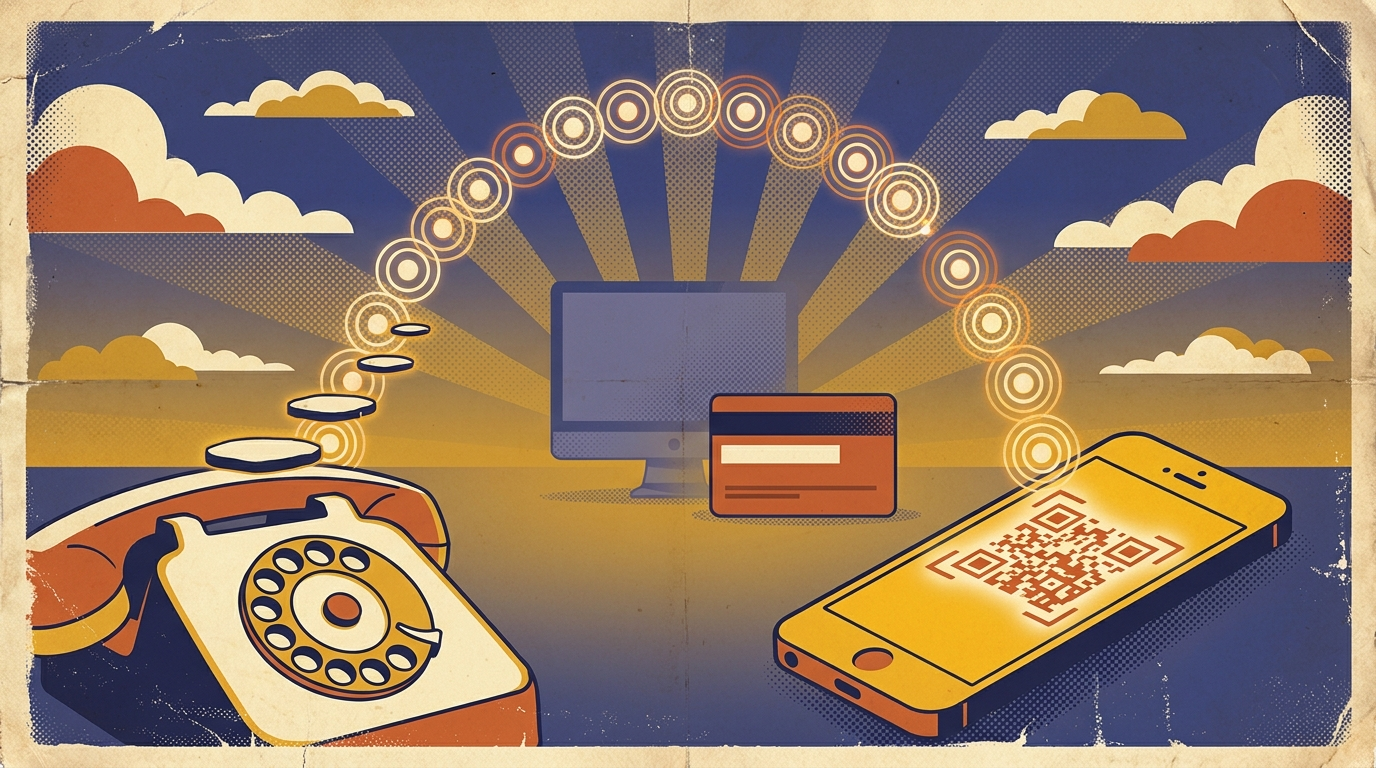
That ratio summarises a pattern repeating across many dimensions of Indian consumer life. Broadcast television to smartphone streaming. Credit cards to QR codes. Department stores to dark store. In each case, an intermediate form factor – one that defined consumer modernity in the West (US / China specifically) – existed in India but never reached the penetration that made it default behaviour. Before it could, a faster substitute arrived: the smartphone sitting on world-class digital rails.
This piece makes three arguments. First, India’s “missing” consumer infrastructure is phantom: present in form, absent in mass function. Second, the smartphone, together with digital public infrastructure, became the convergence point that rendered intermediate layers unnecessary. Third, measuring India by Western proxies – malls per capita, cinema screen density, credit card penetration – misreads the market.
We propose three replacement metrics.Digital Transaction Frequency: monthly UPI transactions per 100 adults.Access Radius: the share of consumption categories deliverable same-day or next-day to the median household.Participation Density: monthly active users on streaming and short-video platforms. By these digital volume metrics, India is already a developed consumer economy. The form factors look different. The outcomes – access, choice, frequency, participation – look arrived.
The Wrong Lens
Before examining the evidence, it is worth naming the misreading directly.
Western analysts – and many India observers – reach for the same set of benchmarks: credit card penetration per 100 adults, cinema screens per million people, fast food restaurant density per capita, television household penetration. These metrics made sense in the US and China because those economies built consumer infrastructure layer by layer: wireline first, then mobile; POS terminals first, then digital wallets; cinema halls first, then streaming; branded restaurant chains first, then food delivery. Each layer was a ratchet. The next one was measured relative to it.
India’s trajectory was not a slower version of that sequence. It was a different sequence.
The comparisons that follow are not offered as equivalencies. A UPI QR code is not a credit card POS terminal. A Swiggy restaurant listing is not a McDonald’s franchise. A JioHotstar subscription is not a multiplex ticket. The point is structural: India used different physical form factors to achieve comparable consumer outcomes – and in several dimensions, superior ones.
Part One: The Phantom Infrastructure
1.1 Wireless versus Landline
In the United States, wireline telephone penetration reached roughly 95% of households before mobile phones arrived. In China, fixed-line density still sits at approximately 12 connections per 100 people. India’s wireline density: 3.33%.
In two decades, India added roughly 6M net wireline connections while the population grew by hundreds of millions. Wireless subscribers climbed from 150M in 2006 to over 1.24B by December 2025. The installed-base ratio is 26:1 in favour of wireless.
An analyst looking at India’s fixed-line numbers in 2005 would have concluded the country was a decade behind. The intermediate layer never became necessary. Mobile arrived before wireline could establish the lock-in it achieved elsewhere.
The leapfrog is now compounding within mobile itself. India crossed 400M 5G subscribers in late 2025, three years after commercial launch, making it the world’s second-largest 5G market. Ericsson projects 1B by 2031. The NSS 80th Round (January–March 2025) found 85.5% of Indian households possess at least one smartphone. Counterpoint Research pegs the active installed base at over 740M.
The downstream effects are that every consumer-facing category in India is, at root, a mobile product design problem.
1.2 Smartphones versus Television
Television household penetration in the United States has held above 96% since the 1960s. In China, 99%. These markets built their consumer entertainment infrastructure around a fixed, shared-screen device in the living room. Advertising, content, and retail were all architected around it.
India has approximately 217–248M TV-viewing households out of 314+ M total HHs – roughly 70% penetration. Against a population of 1.4B, that is a meaningful gap. The comparison that matters, though, is not TV versus TV. It is TV versus the device that replaced its function.
At 740M active smartphones, India’s primary entertainment screen is a personal device in a pocket. Crucially, it is personal rather than shared – enabling individualised content, personalised commerce, and demographic cohorts the television set could never disaggregate. For consumer businesses, this is the superior surface.
India’s smartphone base is more than 3X its TV household base. The US spent 70 years building the TV as its mass consumer access layer. India bypassed it.
1.3 OTT Applications versus Cinema Halls
India had 9,527 cinema screens in 2019. By 2024, the number had barely moved to 9,927 – fractional growth over five years, against a population of 1.4B. At approximately six screens per million people, India is among the most under-screened major economies in the world. The United States operates roughly 40,000 screens for 340M people – nearly 120 per M.
This gap was not closed. It was leapt.
When Jio slashed mobile data prices by roughly 95% in 2016, streaming video to hundreds of millions became economically viable at $0.26 per gigabyte. JioHotstar now averages 450M monthly active users and launched with over 50M paid subscribers. India’s total digital video audience reached 601M in 2025, with 148M active paid subscriptions.
The digital video audience is already 11 times the country’s paid TV subscriber base and 60 times its cinema screen capacity in terms of daily addressable reach.
The comparison of subscription economics to ticket economics makes the architecture visible. A JioHotstar monthly mobile plan starts at approximately ₹99 ($1.20). A multiplex ticket in Delhi costs ₹400–500 ($5–6). A cinema ticket in the United States averages approximately $11–13. The Indian cinema hall, never abundant enough to be default behaviour, is now an expensive occasional event. OTT is the default.
In developed markets, streaming disrupted existing infrastructure – cord-cutting happened because there were cords to cut. In India, streaming was the first mass visual entertainment for hundreds of millions of people. It created a new habit rather than displacing an entrenched one. The consumer psychology of the two markets is entirely different
1.4 Offline Fast Food Chains versus Digital Restaurant Aggregators
The US built its organised food-service sector through branded physical chains. Subway alone operates 20,600 locations in the US. McDonald’s runs 13,000+. Add Starbucks, Domino’s, Chick-fil-A, Taco Bell, and the rest: the US has roughly 200,000+ branded QSR outlets serving 340M people – approximately 600 per million.
India’s branded fast food sector, by contrast, is in its infancy as a physical network. McDonald’s operates approximately 500 stores. KFC runs 600+. Domino’s has expanded to roughly 2,100 outlets across 500+ cities. Subway maintains around 800 locations. Combined across all international and domestic branded chains, India’s organised branded QSR physical footprint is unlikely to exceed 8,000–10,000 outlets for a population of 1.4B – fewer than 7 per million people.
An outsider counting India’s fast food chain density would conclude that organised food service barely exists. The conclusion misses what replaced it.
Zomato had approximately 306,000 active restaurant listings across 800+ cities as of January 2025. Swiggy operates at comparable scale. Combined, the two platforms give organised, rated, menu-transparent, payment-enabled access to over half a million restaurants and cloud kitchen storefronts – virtual branded outlets that exist only as a digital listing but behave, for the consumer, exactly as a branded physical location: consistent product, fixed price, ratings, and reliable delivery.
The physical chain was the West’s method of delivering organised, branded food service. The aggregator platform is India’s. The consumer outcome – access to a consistent, discoverable food product – is equivalent. The capital deployed is orders of magnitude smaller.
Even if we consider like to like DoorDash v/s Zomato - Yes, DoorDash is roughly 15–17x larger by GMV. There's no contest on raw dollar size. But unit economics tell a different story.Zomato operates profitably at $4–5 AOVs in a price-sensitive market. DoorDash only turned its first annual profit in 2024, after years of heavy subsidization in a market where orders are 8x more expensive. Zomato had the leaping benefit.
Part Two: The Indian Metrics That Actually Matter
Establishing that India bypassed Western form factors is the easier argument. The harder one is that India has developed its own metrics of scale – and by those metrics, the market is not emerging. It has arrived.
2.1 UPI QR Codes versus Credit Card POS Terminals
The United States built its consumer payment infrastructure through physical card acceptance. There are approximately 16–18M credit and debit card POS terminals installed across the US – a $29B market that took four decades to build. These terminals sit at retail counters, restaurants, and service providers. Each requires merchant acquiring agreements, hardware installation, network connectivity, and ongoing fees. The infrastructure is capital-intensive, concentrated in formal businesses, and inaccessible to the vast informal economy.
India chose a different physical form factor: the QR code printed on paper or displayed on a phone screen.
As of Q3 2025, India has 709M active UPI QR codes – a 21% increase in a single year. The total cost of a QR code acceptance point: effectively zero. No hardware, no acquiring relationship, no monthly fee. Any merchant with a smartphone and a printed sheet can accept digital payments from any of India’s 839M active UPI users.
The comparison is stark. The US took four decades and roughly $29B in terminal infrastructure to reach 16–18M acceptance points serving formal businesses. India reached 709M acceptance points in less than a decade, at near-zero marginal infrastructure cost, reaching merchants the card networks could never have accessed.
2.2 UPI Transaction Volume versus Credit Card Volume
Measuring India’s payment maturity by credit card penetration produces a misleading picture. India has approximately 115M credit cards, versus roughly 175M in the US. On that metric, India looks behind. The correct comparison uses the actual transaction layer each country relies on for daily commerce.
UPI processed 22B transactions in December 2025, worth ₹27.97 lakh crore. For the full year 2025, UPI handled 228B transactions worth approximately ₹300 lakh crore (roughly $360B). UPI now processes more daily transactions than Visa globally – 640M per day versus Visa’s 639M – a fact worth pausing on. India’s homegrown, government-built payment rail overtook the world’s largest card network by transaction count.
Credit card spending in India reached ₹1.89 lakh crore in November 2025. UPI’s December value was 14.8 times larger. Credit cards serve a specific function in India – credit provision, rewards, and status signalling for affluent consumers in top-30 cities. They are not the default transaction layer. UPI is.
UPI accounted for 84.8% of retail digital payments by volume in H1 2025. India processes 49% of global real-time payment volume.
2.3 OTT Subscription Rate versus Cinema Ticket Cost
The price inversion between OTT and physical cinema in India is structurally different from anywhere else in the world – and it matters for understanding consumer behaviour.
In the United States, Netflix starts at $7 per month. A cinema ticket averages $11–13, making it roughly 1.5–2x a monthly streaming subscription. The price gap exists but is not prohibitive for median households.
In India, JioHotstar’s monthly mobile plan starts at ₹99 ($1.20). A multiplex ticket in a Tier-1 city costs ₹400–500 ($5–6), with premium formats reaching ₹700–1,000. A single cinema outing costs 4–8 months of a streaming subscription. This is not a marginal price difference. It is a structural deterrent.
The BBC reported in October 2025 that Delhi multiplex tickets had reached ₹500, triggering audience pushback and accelerating the migration to streaming. Single-screen tickets in smaller cities are cheaper — ₹100–200 in some states – but those screens are declining in number and quality.
For the Indian median consumer, OTT is not a complement to cinema. It is a replacement built at a price point the cinema hall cannot match. The consumer has already voted.
This dynamic inverts the Western model, where Netflix grew by converting existing cinema habits (Nicole Kidman's viral AMD ad luring customers back into cinemas notwithstanding) into streaming habits among consumers who had been paying $12 movie tickets for decades. In India, OTT became the primary access point for many consumers who had rarely or never been to a multiplex. In India, somehow, heartbreak feels good on OTT.
2.4 Digital Restaurant Storefronts versus Branded QSR Chains
The contrast between India’s physical fast food density and its digital restaurant density tells the same structural story as the payment comparison.
India’s branded QSR physical network totals roughly 8,000–10,000 outlets. Domino’s, India’s largest QSR network, crossed 2,100 stores after 20+ years of operation.
Zomato alone listed 306,000 active restaurants in January 2025, across 800+ cities. That is more than 30 times the entire branded physical QSR base. Swiggy operates at comparable scale. Combined, India’s two leading food delivery platforms have created a digital restaurant infrastructure that dwarfs anything the physical QSR sector has built.
This is not a substitution in the traditional sense. Zomato and Swiggy did not displace McDonald’s. They created an organised food service layer that McDonald’s never could, serving a market that no physical chain had reached. Cloud kitchens – restaurants that exist only as digital storefronts with no physical dining space – make up a significant and growing share of both platforms’ listings. A brand can launch a new food concept, test it across 50 cities, and iterate pricing – all without a single storefront brick-and-mortar lease.
The capital model inverts. A traditional QSR chain spends ₹80–150 lakh per outlet on fit-outs, franchisee fees, and real estate deposit. A cloud kitchen brand launches for ₹5–15 lakh. The digital storefront is the outlet.
2.5 DTH Subscribers versus JioHotstar / Smartphone Subscribers
India’s DTH (Direct-to-Home satellite television) base peaked at approximately 70M subscribers in FY21. By 2025, it had declined to approximately 61M – an infrastructure that consumed hundreds of millions of dollars in satellite capacity investment, set-top box subsidies, and distribution, reaching roughly one-sixth of Indian households at its peak.
JioHotstar averaged 450M monthly active users in Q3 FY26 – a quarter after launching with 50M+ paid subscribers – representing approximately 7.4 times the DTH base at more than one-third of India’s entire population.
The smartphone installed base of 740M is 12 times the DTH peak.
DTH was a meaningful step forward for rural entertainment access when it launched in the 2000s. It remained bounded by hardware cost (set-top box plus dish installation), ongoing subscription fees, and the shared-screen living room model. JioHotstar sits in every pocket at ₹99 a month. It requires no hardware, no dish and no shared family scheduling.
The DTH business model is not collapsing. But as a proxy for video entertainment scale, it is the wrong number. The right number is 450M or maybe Sunday's ICC T20 world cup match final number of 700M peak viewers on Jio-HotStar.
Part Three: The Structural Logic
Four forces made the leapfrog possible – and understanding them matters because they are not accidents of geography or culture. They were policy choices and infrastructure investments that compounded.
The empty field advantage.Low incumbent penetration meant new technologies occupied open ground with minimal resistance. There were no Comcast-equivalent cable franchises defending wireline margins. No Blockbuster-equivalent chain defending physical rental. No Wells Fargo defending a 35-year relationship with a checking account and POS infrastructure. India’s infrastructure gaps became structural advantages.
The data cost collapse.India’s mobile data at roughly $0.26 per gigabyte versus $5–10 in developed markets turned the smartphone into the delivery channel for everything. Streaming, payments, commerce, and communication all became viable at a price point that made mass adoption inevitable rather than aspirational.
Digital public infrastructure.Aadhaar, UPI, Account Aggregator – open, interoperable rails built by the government and made available to every licensed participant. No country has deployed comparable infrastructure at this scale. The US equivalent would require Visa, Mastercard, and the Federal Reserve to co-build a zero-fee, open-API payment layer and mandate adoption. That has not happened and is unlikely to.
Logistics density.A last-mile delivery network – built by Zomato, Swiggy, Blinkit, Zepto, Flipkart, Meesho, and a hundred smaller operators – that substitutes for physical retail proximity. The dark store replaces the department store. The delivery partner replaces the commute to a mall.
These four forces did not arrive sequentially. They arrived together, reinforcing each other over roughly a decade between 2014 and 2025. The smartphone, cheap data, open payment rails, and fast logistics produced, in combination, a consumer infrastructure that the West built through fifty years of physical layer investment.
Part Four: Converting Access into Economics
The leapfrog across these domains is largely complete. The access story is settled. The question that matters in 2026 is whether the businesses built on top of this architecture can convert access into durable returns. Three live tensions define this phase.
The Profitability Frontier in Quick Commerce
Blinkit’s Q1 FY26 revenue reached ₹2,400 crore – 154% year-on-year – with GOV of ₹11,821 crore. Contribution margin improved from -2.4% of net order value in Q4 FY25 to -1.8% in Q1 FY26. Delivery cost per order fell to ₹55, down 14% year-on-year. Store count reached 1,544 by June 2025, targeting 2,000 by December.
These are real improvements on a genuinely difficult operational problem. But Amazon entered the category in September 2025 with “Amazon Now,” and Flipkart launched Minutes. Deep-pocketed incumbents with existing customer bases change pricing dynamics.
Quick commerce has proven it can grow. The open question is whether margin improvement can outrun the pricing pressure that new competition introduces – particularly outside the top eight metros, where order density drops and delivery economics strain.
The Monetisation Gap in Payments
UPI processes 49% of global real-time payment volume. The merchant discount rate has been zero since January 2020. Budget 2026 allocated ₹2,000 crore for UPI and RuPay incentives. The Payments Council of India asked for ₹10,000 crore and proposed a 0.3% MDR on P2M transactions above ₹2,000.
RBI Governor Sanjay Malhotra stated plainly in February 2026: “Someone has to pay for the costs.”
The world’s most advanced payment rail has an unresolved business model. The adoption curve is mature – the RBI’s Digital Payments Index reached 493, nearly five times the 2018 base. The monetisation curve has barely begun. How this resolves – through targeted MDR, value-added services, or continued state subsidy – will shape the economics of every fintech building on UPI rails.
The Physical Counter-Signal
Zudio, Trent’s value-fashion brand, crossed $1 billion in annual sales in FY25 and operated 806 stores across 235+ cities by September 2025, with 75% of recent openings outside major metros.
This is a productive counter-signal, not a contradiction. The leapfrog thesis holds for access and frequency. But premiumisation, trust-building, and category discovery still have a physical component. Zudio’s revenue per square foot declined 13% year-on-year in Q1–Q2 FY26 as densification outpaced local demand – a reminder that physical retail in the “missing middle” carries its own unit economics discipline.
The companies that will define the next phase understand which layers are digital-first and which require a physical touchpoint – and build accordingly.
Implications for Capital Allocation
A few conclusions follow from the architecture above.
The correct benchmark is consumer outcome, not form factor.
Companies built for the actual infrastructure outperform those importing Western blueprints.Meesho is a distribution architecture designed for ₹250 average order values and mobile-only users. Zepto is a logistics-first company built around dark store economics. Both were built for India’s rails. If an India thesis requires consumer behaviour to “mature” toward Western patterns, it is betting against the structural logic above.
The missing middle is the opportunity.Physical organised retail never scaled to Tier-2 and Tier-3 India. Digital commerce did. The 400+ cities beyond the metros are building their first organised retail muscle memory on phones. The economics here are different: smaller baskets, higher delivery cost ratios, longer trust-building cycles, vernacular content, community commerce, voice-first interfaces. This is where low-value, high-volume economics matter.
Physical infrastructure still matters – selectively.Healthcare needs hospitals. Education needs classrooms. Transportation needs roads. For consumer commerce, payments, entertainment, and information, the digital layer is the primary access layer. Knowing which sectors reward digital-first approaches and which require patient physical investment determines whether you build a growth company or a capital sink.
The Bet
India’s consumer economy in 2030 will be something new – a developed-economy outcome achieved through radically different form factors, built on digital rails the West is only now contemplating. The companies that win will be built for how India actually works: mobile-native, rail-native, vernacular-native, designed for the 400 cities beyond the obvious eight.
India will never look like a developed economy in physical form factors. It will feel like one in access, frequency, and participation. The leapfrog established that. The next decade will be defined by the companies that convert leapfrog-scale access into durable unit economics.
Co-Author credit: Baba Prasad Nath